Epoch 2009 Nov. 25.0 TT = JDT 2455160.5
T 2009 Nov. 30.30453 TT MPCW
q 0.6077496 (2000.0) P Q
n 0.23429345 Peri. 217.95895 +0.82677838 -0.56237718
a 2.6059293 Node 176.19108 +0.55206571 +0.80674253
e 0.7667820 Incl. 11.29982 +0.10798596 +0.18137916
P 4.21
From 1096 observations 1989 Mar. 7-2015 Mar. 24, mean residual 0".4.
Finding Charts
Magnitudes Graph
H = 15.3 G = 0.15 [ ,-60] ( - 2009 Oct. 1)
m1 = 15.8 + 5 log d + 20.0 log r [-60, 60] (2009 Oct. 1 - 2010 Jan. 29)
H = 15.3 G = 0.15 [ 60, ] (2010 Jan. 29 - )
* Green curve is: H = 15.3 G = 0.15
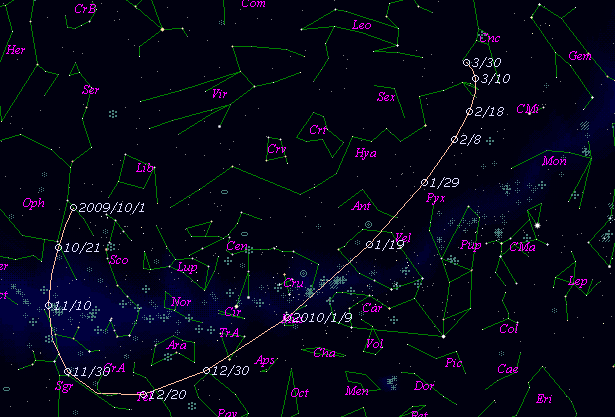
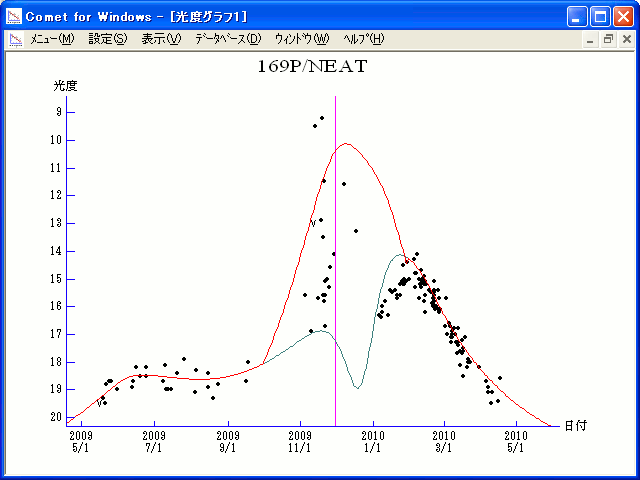
The orbital elements are published on M.P.E.C. 2015-G03.
The charts are made with StellaNavigator Ver.2.0 for Windows
(AstroArts / ASCII).
The magnitudes graphs are made with Comet for Windows.
Copyright(C) Seiichi Yoshida (comet@aerith.net). All rights reserved.