Japanese version Home Page Updated on September 30, 2002
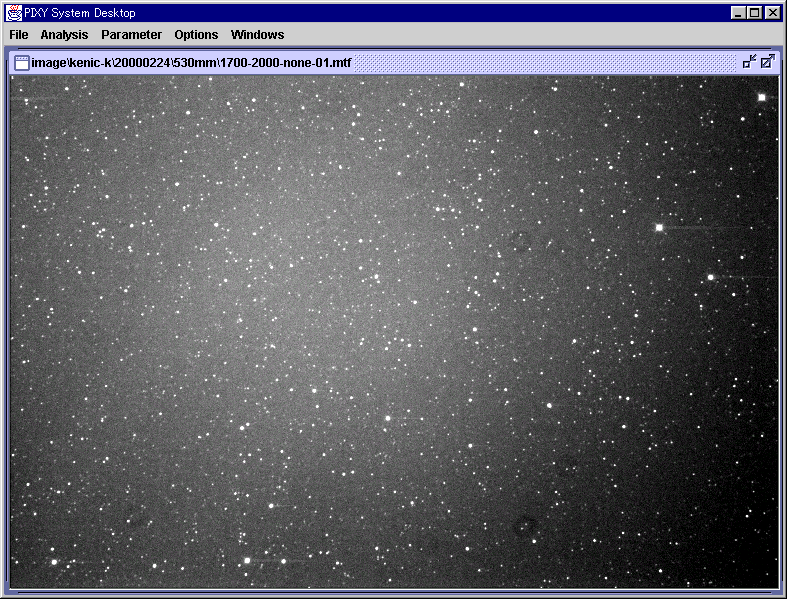
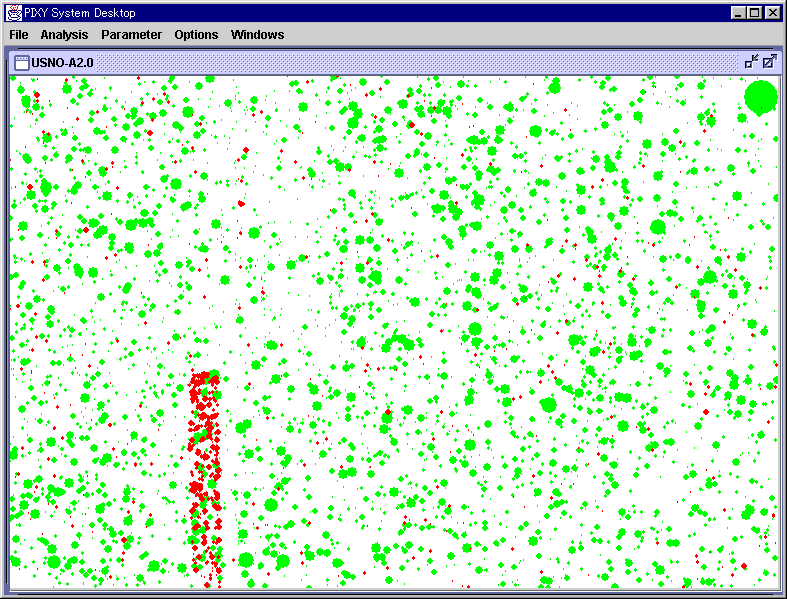
USNO-A2.0 data around R.A. 17 hour, Decl. -20 degThere are some regions where strange data are recorded in the USNO-A2.0. A region at R.A. 17 hour, Decl. -20 deg, is one of them. We can find a belt lying north and south of false stars on the chart. Here is the unfiltered CCD image of this region taken by KenIchi Kadota. 
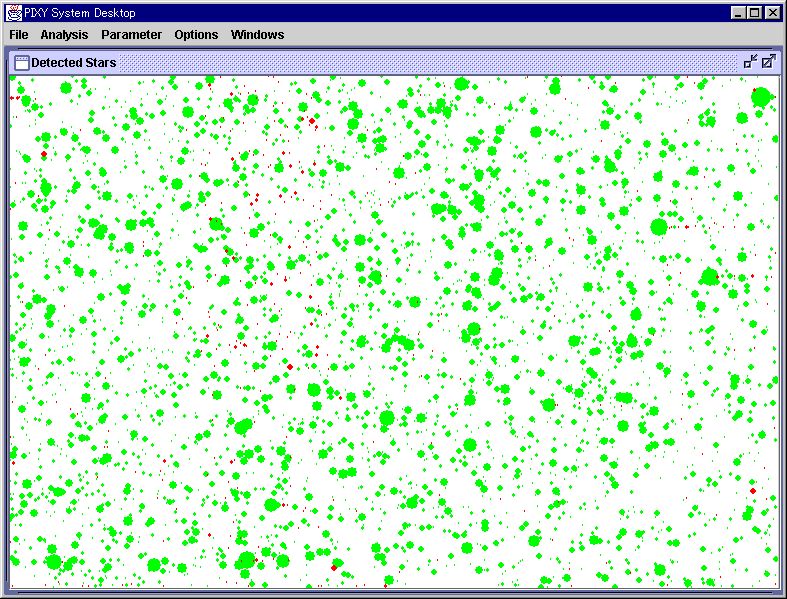
Examining this image using the PIXY System 2, it shows a chart of detected stars, and another chart of the same area plotting the USNO-A2.0 data. Here is the result. A green star is a normal one, detected from the image, and also recorded in the USNO-A2.0. A red star on the "Detected Stars" chart is one detected from the image, but not recorded in the USNO-A2.0. A red star on the "USNO-A2.0" chart is one recorded in the USNO-A2.0, but not detected from the image. We can find that there are many false stars in the USNO-A2.0, which forms a belt lying from the center of the left side of the image towards south. 

NOTE: The stars on the USNO-A2.0 chart are plotted based on the magnitude converted by the Taichi Kato's formula: V = R + 0.375 * (B - R) |
