
Home Page Mon Dec 1 02:11:21 JST 1997
   Next: Linearity between magnitude and Up: Results of experiments Previous: Results of experiments |
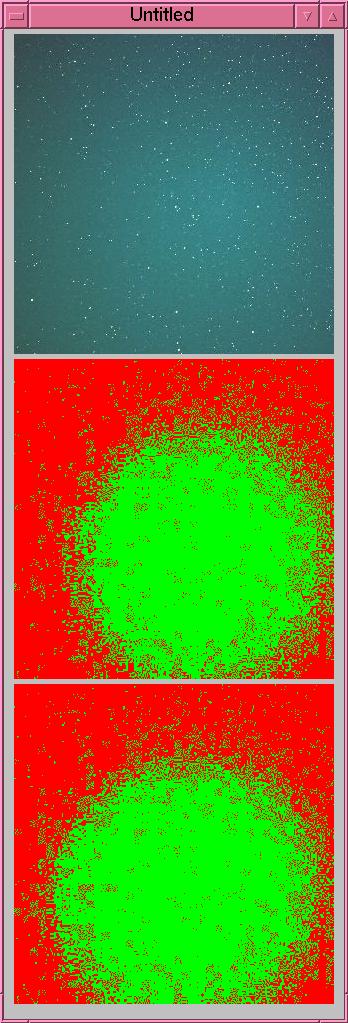
Field flatteningAt first I show you how images could be flattened in the way mentioned in this article. The following images show the distribution of positive/negative value comparing to the sky field. Green means the value is greater than the sky field, red means less than the sky field. In the middle image the sky field is a simple average of all pixel values without field flattening. The bottom image is after restoration of level correction in the way mentioned in this article. When noises appear equally all over the image in the bottom image, it means the experiment succeeded.
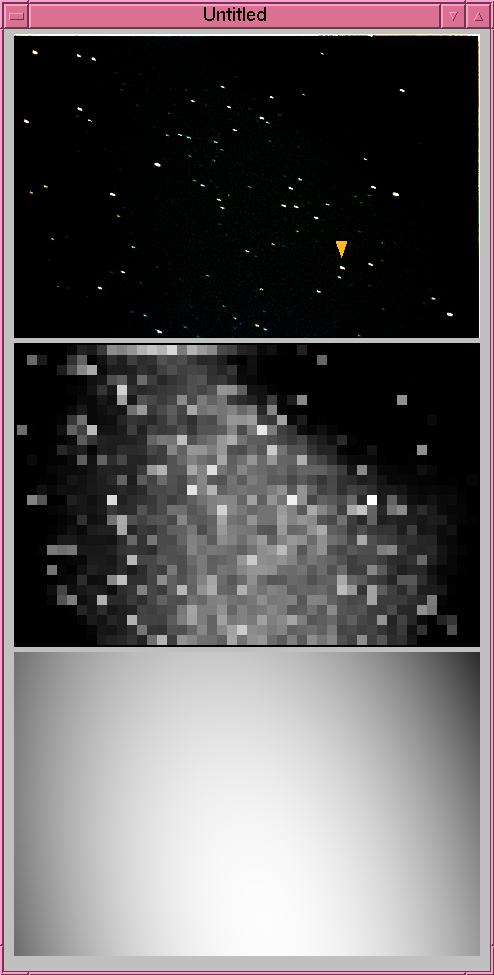
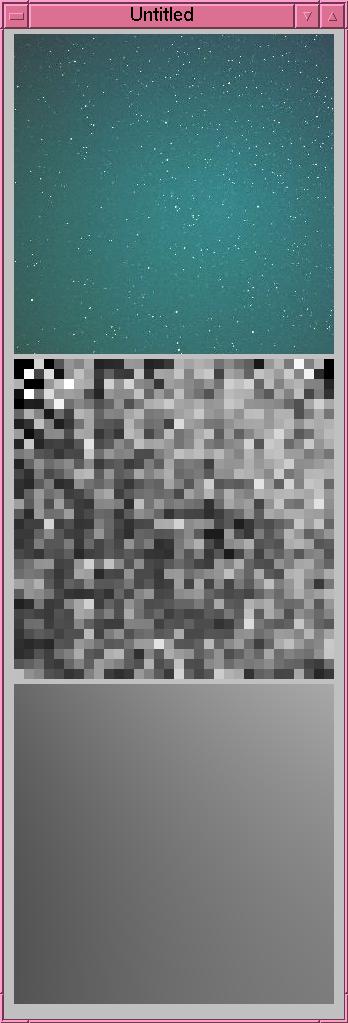
The uneven sensitivity is actually irregular as the image below shows. The center image shows the standard deviations of each 10x10 block and the bottom image shows the obtained flatfield function resembled by a quadratic function. As it shows, there are still some errors with this method.
By the way, this is the result of a JPEG image but the original is in FITS format. However, the result of the original FITS image is quite different. The ellipse in the bottom image is because the current system resemble functions as quadratic. I do not know why they are so different.
|
|
Next: Linearity between magnitude and Up: Results of experiments Previous: Results of experiments |